Thursday, December 23, 2010

Input Output Table Analysis using PyIO ( for Large Matrix )

Recently, I have a paper assignment from my economic modelling class and spend some time to play around with PyIO, a python based application that enable IO table analysis, for sometimes. It's a great apps (not to mention it is free, fast and easy) and it had greatly reduced the amount of time for me to understand how the IO calculation actually works.

Actually you can use Matlab, Octave or mathCAD to do this, but I believe you would require more time in learning the entry command, matrix operation, balancing the table, do data transformation back and forth, etc. You wont like it, trust me !

So I decided to give PyIO a go and installed this software on my Vista 64-bit, 4 GB Memory. MS Excel is not required, but it is nice to have. I do the following to 2005 BPS 66 x 66 sector operations:

Tested and Working:
1. Sector aggregation,
2. Leontief Inverse,
3. Ghoshian Inverse,
4. Impact Analysis,
5. Output, Input, Income, Employment multiplier,
6. Key Sector Analysis (Forward & Backward Linkage), (This is imperative)
7. Multiplier Product Matrix Analysis, (This is interesting)
8. Extracting method (Removing 1 sector from the economy,
9. Push-Pull Analysis (Difficult to understand, various probability),
10. Field of Influence

Not yet tested (but it should be working though):
1. RAS update
2. Output Decomposition

Basically everything works fine, the result can be chosen, between "Interactive Excel Data Entry" or "Tab Separated Format". I often choose the later. However I did encounter serious problem when I inputted a 175 x 175 matrix. The matrix wont showed-up (as shown in the pic below). After further inspection into the code, I saw what may have caused it, apparently the windows size is hardcoded so that the horizontal grid is maxed out to a just (100-3) cells = 97 cells, arrgghh... awfully pity !

Crawling to various URL in the internet (Google search power is getting worst and worst these days, geezz..), I see a lot of junk of information regarding PyIO, no solutions of how to overcame large matrix calculation limit. I also have tried various ways from downloading py2exe apps, trying to re-write the code, but to no avail. Tired of trying, I abandon the idea of using PyIO for calculating large matrices, but that is until recently, when I uncovered that I can large matrices calculation with it..

So How?

Just use PyIO older version ("Lowtek rulez eh ?"), the one with command line, this older version is much more powerful than you think. You can download it from here: http://www.real.illinois.edu/pyio/OldversionsPyIO/pyio.zip

In the future, it will be hard to find them all, so I took the initiative to preserve this PyIO release and pack them into one zip consisting of:

  1. PyIO version 1.0
  2. Python-2.2.3
  3. Mark Hammond win32all-152.exe
  4. Numeric-23.0.win32-py2.2.exe (no longer available)
  5. Some PDF/Whitepapers mentioned in the PyIO manual
  6. Indonesian 2005 66x66 sectors and 175x175 sectors (Producers Prices), Employment, Income. (provided as-is, accuracy is not guaranteed)

You can download it from here: (multiple download link will soon be available). Credits goes to the respective apps programmers/contributors.

Instructions:

  1. Install package #2, #3, #4.. (see above)
  2. Install package #1, all into the same folder
  3. Copy your input file (in this case 175sector.txt and/or 66sector.txt into that folder too,
  4. Start -> run -> cmd
  5. Navigate to the folder, using multiple cd command
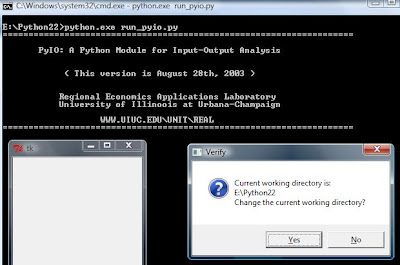
  6. type python.exe run_pyio.py, a screen like this should appear:

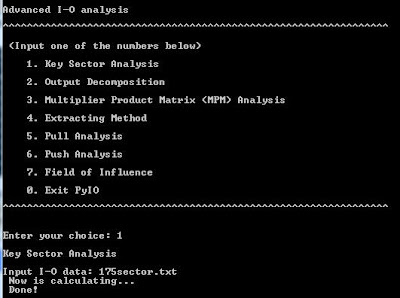
  7. Once you are in the menu, just type what you want to calculate, for example for "key sector analysis" then type "3" and then type"1" , enter the file name "175sector.txt", dont use excel output if you are calculating a large matrix because the result will not appear instantly, so just use the text file.
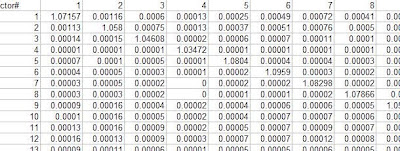
  8. Rename the output file *.out to *.txt, and use Excel to open it. All cell
    should be displayed nicely.
Okay, that's all from me, make a good use of them (what i actually mean is "Abuse It!!" :) ) , and....
Have Fun !

Wednesday, December 15, 2010

Economics of Happiness

“For 60 years, Gross Domestic Product, or GDP for short, has been the yardstick by which the world has measured and understood economic and social progress. However, it has failed to capture some of the factors that make a difference in people’s lives and contribute to their happiness, such as security, leisure,income distribution and a clean environment–including the kinds of factors which growth itself needs to be sustainable.."
- Joseph Stiglitz, “Progress, What Progress?” (March, 2009)


I'm not going to belittling GDP nor GNP as an important measures of an economy, but I should remind us, including me myself that we sometimes forget that once again Economics is never about a profit maximization nor production maximization science, it is a utility maximization science.


I always dreamed to go to NZ, admiring its beautiful landscapes, winds and cattles. And then I realize, the urges came from my expected happiness, that believes the following:

1. Money do affect happiness, at least to a certain point / cut-off value.

Beyond a certain level of income, money has little relevance with my happiness, in
fact giving me more money will give me negative happiness ?

Why ? Because more money will make me worry of economic jealousy from neighbours that will attempt to seize my money/assets forcefully even if I make my own fortune painstakingly, thus giving me an overall negative happiness.

2. Money doesn't buy me relationship, health, leisures and freedom.

Although consumerism gives people a short-run happiness to some extent, but the same economic activities that support the consumerism, drains many happiness, for example excessive work cause divorce, bad health from pollution or overworking, reduced leisure and creative activity and globally it reduce freedom (long-run happiness). This is subjective but it still can be quantified through social metrics, such as number of marriage and divorce, mental and physical health disorder records, leisure sector activities, specific crime rates, ecological deteoriation, etc.

3. Unimportant activities disallocated Resource required for sustaining life.

Why do I need to cut down forest, killing all the animal in the process, just to build a timber processing plant, where it produces carbon emission, polluting surrounding environment, just to provide woods for exported furnitures.


4. Happiness is difficult to measure, but it is not impossible.

I know that GDP/GNP is easier to calculate, convert and compare, thus it is portable statistics to make analysis of, and Happiness is subjective and can be used as political tools by the government to strengthen their legitimacy. But isn't it better to calculate something vague using imprecise tools rather than using wrong tools. it's like using GPS (precise tools to measure position) to approximate temperature (applied to measure the wrong subject) ).

Happiness Snapshot from Russia :


And also there are growing concerns among big countries to apply and incorporate Gross National Happiness (GNH) or GDH or whatever it will be called, into their national target, something that Bhutan had already done since 1972. According to Associated Press, Nov 15, 2010:

  • "There is growing international recognition that to measure national well-being and progress there is a need to develop a more comprehensive view, rather than focusing solely on gross domestic product"- Jil Matheson, UK.
  • French President Nicolas Sarkozy ... two years ago asking two Nobel prizewinning economists to devise ways to measure quality of life factors in addition to simply economic factors when France it studying its policy options.

And also some facts that although GDP have increased, happiness is decreasing :

  • American Journal of Psychiatry the rates of depression across almost all demographic groups have risen in the United States over the past 10 years, with major depression rising from 3.33 percent of U.S. adults in 1991-1992 to 7.06 percent in 2001-2002: In other words, it has more than doubled.

So.... Does Money still "Granger Cause" your Happiness ?